ecoprintQ PaperCut Save Tress

How to save 280,451 trees with one PaperCut feature

If you’re reading this you’re most likely at a crossroads with printing for your business. You’re then most likely asking yourself, “There must be better ways to print today?” That line of questioning will lead you to ask if there are better ways to cut costs, better ways to keep your team safe, better ways

Read More

Intuitive v3 ecoprintQ print hotspots

Print Hotspots

How do I use Intuitive for PaperCut MF v3 to identify expensive print hotspots in my organization? Fill out the form below in order to get a 40 day trial. This Intuitive new version 3.0 includes 8 pre-configured dashboards that will help you to analyze and have more into deep experience with new important features for data visualization as including:  ecoprintQ is committed to delivering excellent service to every customer, providing support at each phase of an

Read More

Intuitive ecoprintQ environmental

Environment Dashboard

How do I communicate the environmental costs of printing to my team members?  Watch this short video to find out how. Fill out the form below in order to get a 40 day trial. This Intuitive new version 3.0 includes 8 pre-configured dashboards that will help you to analyze and have more into deep experience with new important features for data visualization as including:  ecoprintQ is committed to delivering excellent service to every customer, providing support

Read More

Improve Your Print Estate Management

Supercharge your customer QBRs with our Printer Analysis dashboards – showing under and over-utilized printers, allowing you to reduce maintenance costs and better utilize your print estate. Fill out the form below in order to get a 40 day trial. This Intuitive new version 3.0 includes 8 pre-configured dashboards that will help you to analyze and have more into deep experience with new important features for data visualization as including:  ecoprintQ is committed to

Read More

Understand Your Scanning Volumes

How do I find out where scanning is taking place in my organization? Which users, departments, or processes are driving volume? Watch this video to find out more Fill out the form below in order to get a 40 days trial. This Intuitive new version 3.0 includes 8 pre-configured dashboards that will help you to analyze and have more into deep experience with new important features for data visualization as including:  ecoprintQ is committed

Read More

Analyze Print Volume Changes

How do I compare my print volumes from one year to the next? And can I see this analyzed by department? Watch the video to find out how. Fill out the form below in order to get a 40 day trial. This Intuitive new version 3.0 includes 8 pre-configured dashboards that will help you to analyze and have more into deep experience with new important features for data visualization as including:  ecoprintQ is committed

Read More

Top 100 documents

How do I see the top 100 documents that are being printed in my organization? Use Intuitive for PaperCut dashboards to find out. Fill out the form below in order to get a 40 day trial. This Intuitive new version 3.0 includes 8 pre-configured dashboards that will help you to analyze and have more into deep experience with new important features for data visualization as including:  ecoprintQ is committed to delivering excellent service to

Read More

Intuitive v3 ecoprintQ

Why use Intuitive for PaperCut MF instead of PaperCut reports?

Why should I use Intuitive instead of the PaperCut Reports?  Watch this short video to find out why! Fill out the form below in order to get a 40 days trial. This Intuitive new version 3.0 includes 8 pre-configured dashboards that will help you to analyze and have more into deep experience with new important features for data visualization as including:  ecoprintQ is committed to delivering excellent service to every customer, providing support at each phase of

Read More

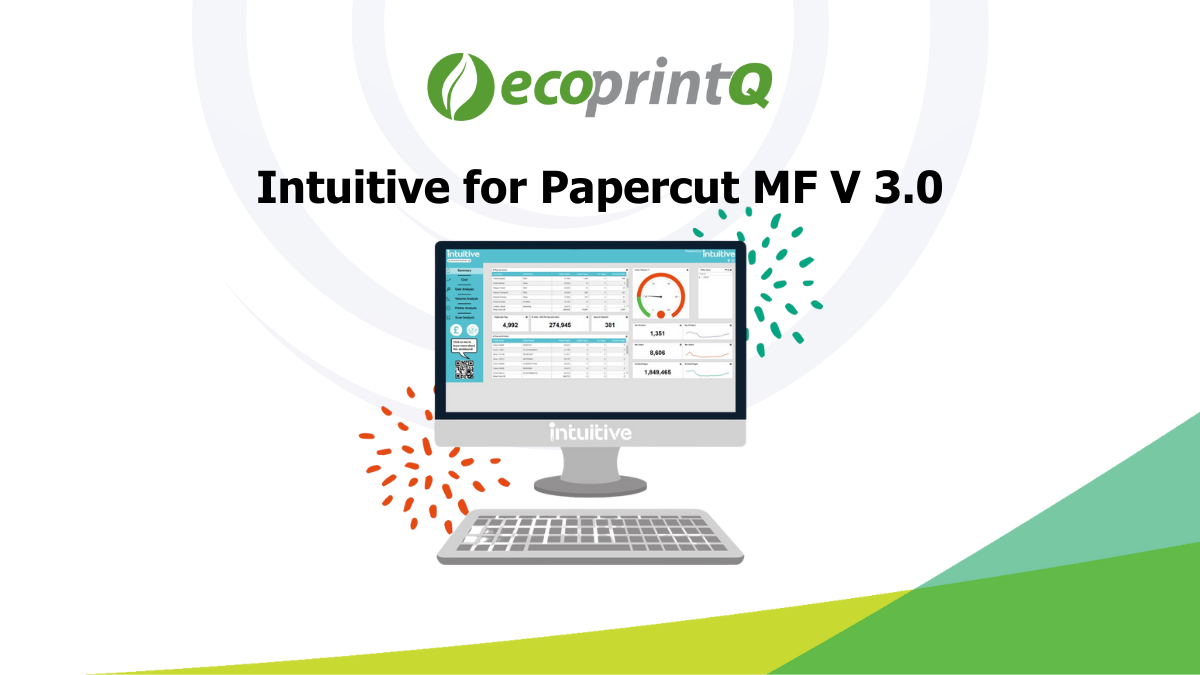
Introducing Intuitive for PaperCut MF Version 3 ​

This new version has had a thorough overhaul, with a new look and many powerful new features. The dashboards incorporate filters, which provide more granular scope of your data, and grid row totals, which allow you to calculate sums, averages and high/low values in your components. Intuitive for PaperCut provides a quick live view of

Read More

Language »