What is a dashboard?
A Business Intelligence (BI) dashboard is an interactive way to visualize and navigate through important business metrics and data. Typically a dashboard will give a high-level view and from there the user can “drill down” to get more specific insights. The goal is to take a huge amount of data; possibly from different sources like your print management system, and potentially other additional data sources such as Excel; and present it in such a way that you can use the information to enable changes to be made.
It can be useful to think of a BI dashboard as a bit like the dashboard in your car. As you’re driving along you can quickly scan the dashboard in your car to determine how fast you’re going, how much fuel you have remaining, and what the temperature is outside. Moreover, it will quickly highlight critical issues that will affect the performance of the car. Good BI dashboards have the same qualities in that they should provide meaningful visual insights without needing a huge amount of effort to interpret them.
So what makes a good dashboard?
Not all BI dashboards are good, and some are downright awful. What separates the good from the bad?
Many dashboards make the mistake of trying to provide too much information – A good dashboard should highlight the key issues that need addressing and allow the user to drill into a particular metric to get more granular and meaningful insights.
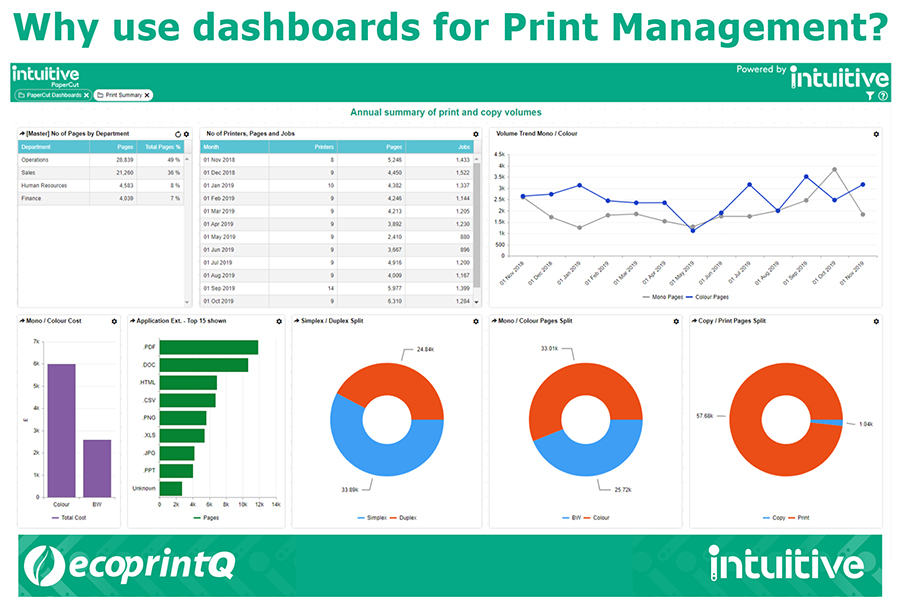
For example, in a good Print Management dashboard, you can see the total color printing volume for an organization and then allow the person viewing it to drill down to view the top 10 employees who are printing in color. Want to know more? The user can drill even further to discover how much color is being produced by application (pdf, email, web printing, etc).
This flexibility of choosing between a global view and more granular analyses on the fly is extremely powerful. Being able to present information in a visually pleasing way to understand things like expensive and excessive color printing (and who is doing the most of it!) is invaluable.
Why use Print Management dashboards?
In our experience, analyzing an organization’s print usage and behavior from the Print Management system is time-consuming and extremely repetitive. Generating reports the old-fashioned way through Excel and manually creating a report can take ages and can be highly error-prone. A traditional spreadsheet usually requires a great deal of hand-holding and explanation for the receiving party to get any use from it. Traditional report generation often leads to more questions that entail more work to answer. A good print management dashboard allows for questions to be answered on the fly simply by drilling further into information sets.
For example, dashboards can quickly answer questions such as:
- How can I identify expensive print hotspots?
- How can I improve the efficiency of my print estate to save costs?
- Which devices are being used most for color printing?
- Which activities are creating demand for color printing?
- What documents did that employee who recently resigned print before they left?
Take a look at Intuitive’s YouTube channel for a range of short videos that demonstrate their print management dashboards.
Are dashboards only for Print Management?
There are lots of other great uses for BI dashboards. Almost all industries and verticals are collecting mountains of data these days. Some common ones are for board-level KPI briefings, account management reviews, HR analysis of staff turnover, and accounts payable automation management. There is hardly a vertical or industry that would not benefit from using BI dashboards to improve their understanding of critical business issues.
Experts in all things Intuitive and print management, ecoprintQ is committed to delivering excellent service to every customer, providing support at each phase of an opportunity, and promoting solutions at every level. As a result, ecoprintQ is one of the world’s top Authorized Solution Centers. If you’d like to find out more about how dashboards could work for your organization, give us a call at 800.236.8499 or email us at sales@ecoprintq.com.