Intuitive Dashboard

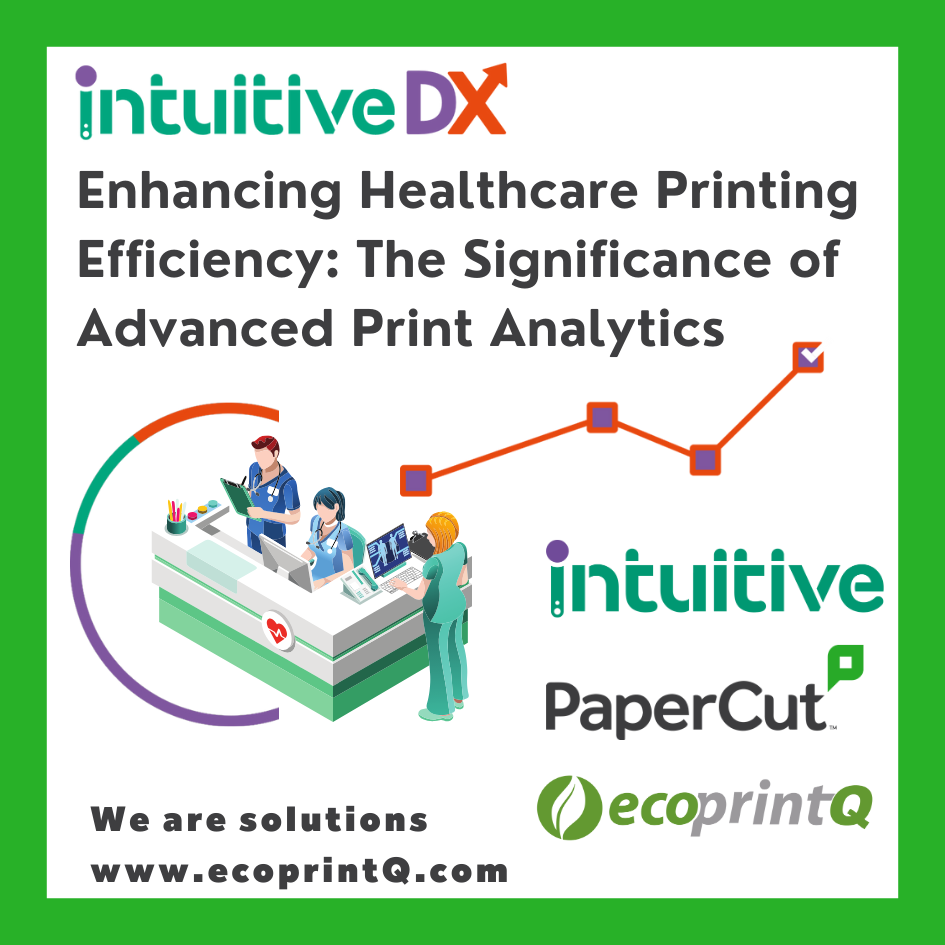
Enhancing Healthcare Printing Efficiency: The Significance of Advanced Print Analytics

The healthcare industry is grappling with various challenges, including escalating costs, staffing shortages, heightened service demand, post-Covid recovery, and the push for increased digital health investments. Despite the UK National Health Service’s plan to go paperless over five years ago, recent reports revealed significant expenditures on paper medical records storage, indicating a substantial volume of […]
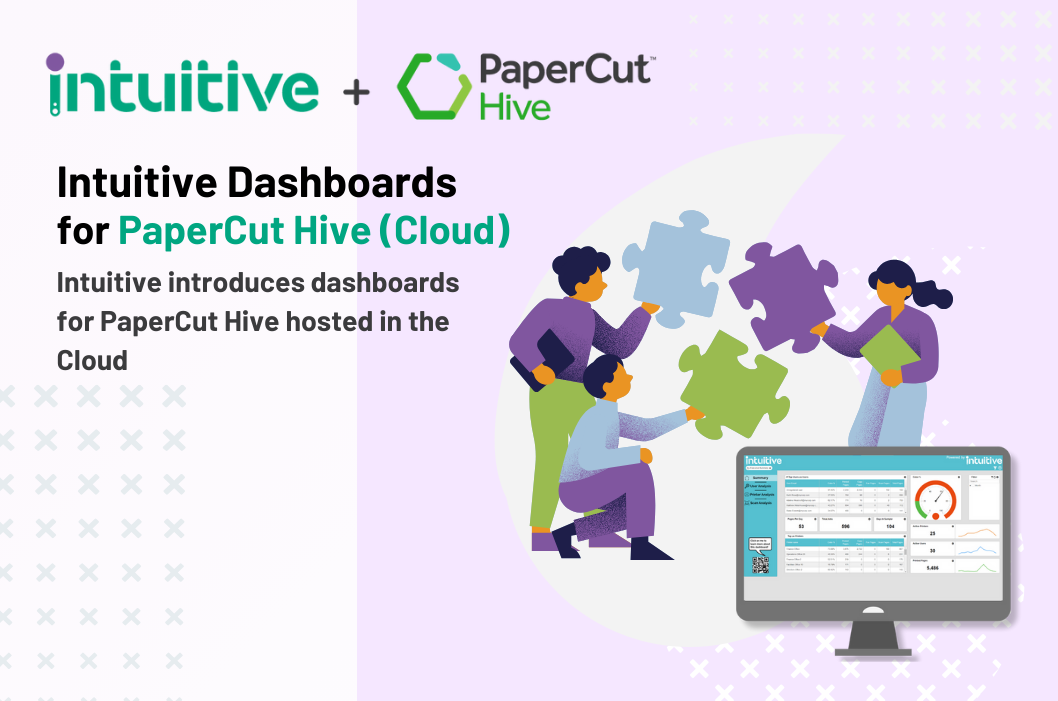
Unlocking Print Management Potential with Intuitive Dashboards for PaperCut Hive

Maximize the potential of your PaperCut Hive print management software with the seamless integration of Intuitive Dashboards. Our intuitive dashboards offer a comprehensive visual data summary, empowering key stakeholders to manage and control print usage and expenditure effortlessly. This blog explores how Intuitive Dashboards can revolutionize your print management experience with six pre-integrated dashboards, cloud […]

Breaking Barriers with Intuitive Dashboards: Conquer Your Business Challenges Like a Pro

In the fast-paced business world, staying ahead of the curve is crucial for success. With the increasing complexity of data and the need for actionable insights, leveraging intuitive dashboards has become a game-changer. These powerful tools not only enable businesses to visualize their print data but also provide valuable insights to address critical challenges. In […]

Environment Dashboard

How do I communicate the environmental costs of printing to my team members?  Watch this short video to find out how. Fill out the form below in order to get a 40 day trial. This Intuitive new version 3.0 includes 8 pre-configured dashboards that will help you to analyze and have more into deep experience with new important features for data visualization as including:  ecoprintQ is committed to delivering excellent service to every customer, providing support […]

Improve Your Print Estate Management

Supercharge your customer QBRs with our Printer Analysis dashboards – showing under and over-utilized printers, allowing you to reduce maintenance costs and better utilize your print estate. Fill out the form below in order to get a 40 day trial. This Intuitive new version 3.0 includes 8 pre-configured dashboards that will help you to analyze and have more into deep experience with new important features for data visualization as including:  ecoprintQ is committed to […]

Understand Your Scanning Volumes

How do I find out where scanning is taking place in my organization? Which users, departments, or processes are driving volume? Watch this video to find out more Fill out the form below in order to get a 40 days trial. This Intuitive new version 3.0 includes 8 pre-configured dashboards that will help you to analyze and have more into deep experience with new important features for data visualization as including:  ecoprintQ is committed […]

Top 100 documents

How do I see the top 100 documents that are being printed in my organization? Use Intuitive for PaperCut dashboards to find out. Fill out the form below in order to get a 40 day trial. This Intuitive new version 3.0 includes 8 pre-configured dashboards that will help you to analyze and have more into deep experience with new important features for data visualization as including:  ecoprintQ is committed to delivering excellent service to […]

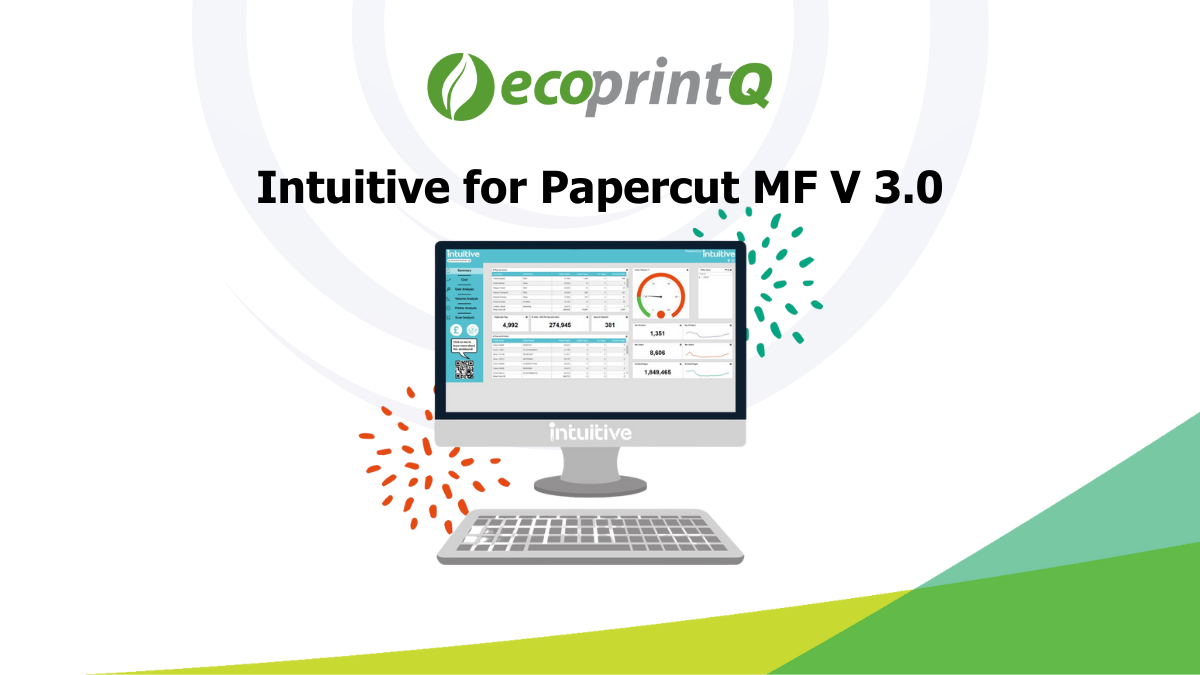
Introducing Intuitive for PaperCut MF Version 3 ​

This new version has had a thorough overhaul, with a new look and many powerful new features. The dashboards incorporate filters, which provide more granular scope of your data, and grid row totals, which allow you to calculate sums, averages and high/low values in your components. Intuitive for PaperCut provides a quick live view of […]

Intuitive White Paper: Management Information for Print and Process Management

This new White Paper from Intuitive considers the Business Challenges of Business Intelligence and Management Information with reference to its use for print and process management dashboards. It reviews the limitations of some approaches to business intelligence and suggests 5 ways of improving management information. It also discusses 7 key benefits of modern BI / […]

Scroll to top
Language »